About

Ahead of the Curve provides you with analysis and insight into today's global financial markets. The latest news and views from global stock, bond, commodity and FOREX markets are discussed. Rajveer Rawlin is a PhD and received his MBA in finance from the Cardiff Metropolitan University, Wales, UK. He is an avid market watcher having followed capital markets in the US and India since 1993. His research interests includes areas of Capital Markets, Banking, Investment Analysis and Portfolio Management and has over 20 years of experience in the above areas covering the US and Indian Markets. He has several publications in the above areas. The views expressed here are his own and should not be construed as advice to buy or sell securities.

Featured post

Time Series Analysis with GRETL

This video shows key time-series analyses techniques such as ARIMA, Granger Causality, Co-integration, and VECM performed via GRETL. Key dia...

Sunday 27 September 2015

Market Signals for the US S and P 500 Index and Indian Stock Market Nifty Index for the Week beginning September 28


Indicator
Weekly Level / Change / Significance
Implication for
S & P 500
Implication for Nifty*
S & P 500
1931, -1.36%
Bearish
Bearish
Nifty
7869, -1.42%
Neutral**
Bearish
China Shanghai Index
3092, -0.18%
Neutral
Neutral
Gold
1146, 0.56%
Bullish
Bullish
WTIC Crude
45.34, 0.04%
Neutral
Neutral
Copper
2.28, -4.14%
Bearish
Bearish
Baltic Dry Index
943, -1.77%
Bearish
Bearish
Euro
1.1194, -0.94%
Bearish
Bearish
Dollar/Yen
120.60, 0.75%
Bullish
Bullish
Dow Transports
7851, -2.31%
Bearish
Bearish
US 10 year Bond Yield
2.17%, 1.78%
Bearish
Bearish
Nyse Summation Index
-365, 2.98%
Bullish
Neutral
US Vix
23.62, 6.01%
Bearish
Bearish
20 DMA, S and P 500
1955, Below
Bearish
Neutral
50 DMA, S and P 500
2023, Below
Bearish
Neutral
200 DMA, S and P 500
2065, Below
Bearish
Neutral
20 DMA, Nifty
7832, Above
Neutral
Bullish
50 DMA, Nifty
8187, Below
Neutral
Bearish
200 DMA, Nifty
8389, Below
Neutral
Bearish
India Vix
20.88, 14.16%
Neutral
Bearish
Dollar/Rupee
66.14,0.44%
Neutral
Neutral


Overall
 S & P 500
Nifty

Bullish Indications
2
3

Bearish Indications
10
11

Outlook
Bearish
Bearish

Observation
The Sand P 500 and the Nifty were down last week. Indicators are bearish.
We are entering a weak period for risk assets globally and massive declines are likely in both indices in the upcoming months.


On the Horizon
 RBI Policy, US Personal Consumption & Consumer Confidence, German & EU CPI, Canada GDP, US & China PMI Data, US & German Employment Data,


*Nifty
India’s Benchmark Stock Market Index


Raw Data
Courtesy Google finance, Stock charts, FXCM


**Neutral
Changes less than 0.5% are considered neutral


 The markets resumed their downtrend last week. Signals are strongly bearish for the upcoming week and markets are in #crash mode. The #SandP500 and several global indices are completing massive bear flags which are resolving to the downside. There will be more downside upcoming in the #Nifty and the S and P 500, with at least a retest of the lows for the S and P 500 near 1867 and Nifty near 7550 in the upcoming days. You can check out last weeks report for a comparison. You can also check out snapshots of the S and P 500 and Nifty Indices. Love your thoughts and feedback.
Hottest Deals On Refurbished Apple Products | JemJem

Thursday 24 September 2015

Bear Flag Break Downs in Several Key Global Stock Market Indices With Crash Implications

Several key global indices are in the middle of massive bear flag breakdowns:
a) First the S and P 500 index shows a massive bear flag breaking down, with the flag forming below the cloud. Highly bearish implying a target below 1800:

b) Secondly the German Dax with a similar bear flag break down below the cloud targeting levels below 8700:

c) Thirdly the UK FTSE index is currently breaking down from a bear flag below the cloud targeting levels below 5500:

d) Fourth the Brazilian Bovespa is in the middle of a massive break down from a bear flag pattern yet again below the cloud with targets below 42,000:

e) Lastly the Indian #stock market Nifty Index has completed a bear flag and a break down underway has targets below 7200:

Not a coincidence then that bear flag break downs are taking place across the board across key international stock markets with significant downside implications. With these break downs forming below the cloud a crash like scenario could result in the upcoming days.

Monday 21 September 2015

Five reasons why crude quotas will not support prices

Guest Post:

By:

M. S. Sriganesh

Head Sourcing

Galaxy Surfactants Limited


With sagging crude market, OPEC (Organisation of Petroleum Exporting Countries) has restarted the talk of coordinating with other producers to balance market and support prices. Though in the past quotas have worked well, this time we believe will not work. Why?

Why OPEC thinks its strategy will work:

With crude correcting more than 50% to the current levels in the proximity of $50/bbl, returns of the producers have been severely impacted. The following 5 critical data points validate the approach of OPEC to keep producing and hold market share while waiting for less efficient producers to exit:

1. Crude prices in the proximity of $ 50/bbl, most producers are margin positive except for producers in US, Brazil, Russia and Canada which are the new competition. Hence at current levels for OPEC it is loss of profit rather than absolute loss while for its competitors it is an absolute loss:

2. However, over the last decade supported by high prices, producer countries have built up expenditure commitments for which a higher $/bbl price is required. Since most producers are producing at near peak capacity, increasing production to compensate is not an available option:

3. Commodity businesses are cyclical in which strong producers use up-cycles to build reserves which are used in lean periods, which is visible in this industry. Since OPEC is about National Oil Companies (NOC), Country reserves are a good measure. If the prices remain at $50/bbl levels, then except for Venezuela, Nigeria & Ecuador, most producers have a cushion to support. If the low prices continue to remain low, then the impact will spread and magnify:
Hottest Deals On Refurbished Apple Products | JemJem

4. Most producers have a high dependence on the ONG (Oil & Gas) industry with more than 30% share of the GDP:

5. Additionally, exports of these countries have a much higher skew in favor of ONG based products:

Consequentially OPEC has no option but to continue to produce to full capacity and let price fall making its more expensive competitors to exit. Quotas can be used to further reduce fragmentation in the market like in the past and get price support.
We see the above analysis optically correct while fundamentals show a different story. Here's the other picture.

5 reasons why quotas will not work:

The reason why we see this time as different is for the reasons below:

1. Changed strength of OPEC:

 In the 1970's OPEC has controlling more than 50% of the global production which currently has fallen to near 40%. The global consumption growth over the decades has been largely absorbed by non-OPEC production. As a result, the strength of OPEC no longer remains similar to the past with higher number of players and more fragmentation.

2. Changing Customer profile: 

In the 1970's, the largest consumer USA's imports were 88% from OPEC which currently is 15% (2.9 MBPD out of total consumption of 19.035 MBPD). Even today USA remains the largest consumer with largely regional production (N America) catering to its demand. If we see regional demand-supply mapping, the Americas are nearly balanced leaving the rest of the world to consume OPEC production. This leads to 5-6 countries (China, Japan, India, S Korea & Singapore) requirement balancing with OPEC surplus. The Americas is creating a regional Moat and forcing OPEC to focus on Asian consumption which is altering the bargaining power of the buyers. This is evident from the statement of the Indian Petroleum Minister that "oil producers should stop charging premium from its Asian buyers and offer better trade terms like selling oil without payment guarantee and on extended credit period":

3. Changing feed stock preference: 

Natural gas has grown to become an alternative for transportation, power generation and industrial applications displacing crude demand.  This has resulted in doubling of global natural gas demand from 1980 to 2010. From an environmental point of view, natural gas is a cleaner fuel than coal & crude adding traction to its demand. Lastly, natural gas is a regional play as there is limited role played by inter-continental movements. In short the markets have changed.

4. Power of the alternative: 

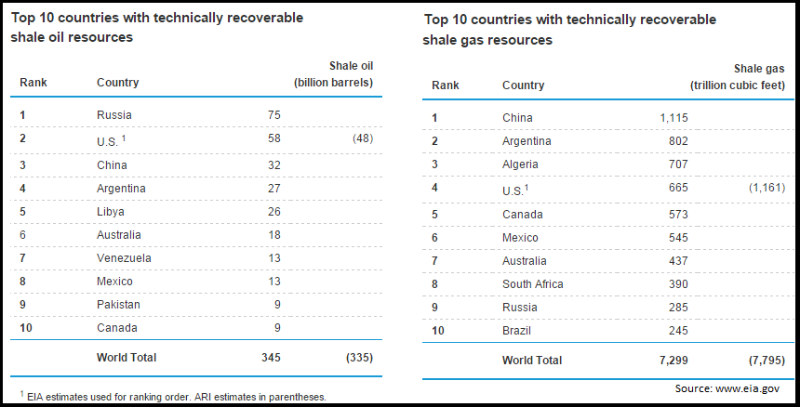
US shale is considered the main competitor to OPEC. Shale industry is a private initiative unlike OPEC which is NOC. Private initiative coupled with innovation has brought about this revolution that even at $ 45/bbl (WTI) production is not falling of the cliff indicating a powerful signal to unravel. Producers are trimming cost & changing the drilling patterns to ensure that even at these low prices production continues. Efforts are underway to propagate the shale technologies regionally to countries like Mexico. In order to balance the grade requirements, swaps are being planned which will further reduce dependence. Also, globally for energy security considerations, propagation of this technology is underway. China, OPEC's largest consumer and also one of the largest technical proven reserve holder of shale, is working to exploit its reserves.There is a Chinese Government grant to encourage shale production.  Europe which has been dependent on Russia for its gas  and had had supply disruption issues, is already prospecting for shale in the UK, Poland, Germany, Romania, Denmark and Hungary and commercial drilling is expected to commence this year. Countries like Britain are changing rules to fast track this progress. As a pattern, decoupling from the Middle East & localizing is visible:

5. The SWITCH: 

The shift of the swing producer status from Saudi Arabia to US creates a switch mechanism on supplies as a result of which a ceiling on crude prices has emerged. Every time the prices fall below the marginal cost of production, supplies get switched off and once the prices move above supplies get switched on. This is facilitated by shale, Tar sands, etc being onshore business which can support this mechanics. As a result, quotas can only move the needle from the margin negative to marginal cost of shale.

In summary:

Post the oil shock, surges in oil prices have been favorable to OPEC populations at the expense of the billions of consumers across the globe. Additionally, the middle east with a history of local issues, has always been perceived as an unstable source and engaged with due to lack of options. While coordinated action like quotas tends to work on short to medium terms to distort markets, in the long term competition happens at the level of competencies.
Two quotes from Saudi Sheik Ahmed Zaki Yamani who was also a minister in OPEC for 25 years reflect the current developments very aptly:
"The stone age didn't end for lack of stones, and the oil world will end long before the end of oil".
"Technology is the real enemy".
This shift in the industry dynamics makes is very interesting for top Asian buyers like China, Japan, India, Korea and Singapore to coordinate and unify the petroleum policies of its Countries and ensure the stabilization of oil markets in order to secure an efficient, economic and regular supply of petroleum to consumers free of distortion.

About M. S. Sriganesh:

Sriganesh tracks and analyzes markets from the perspective of its structure, competitiveness and evolution mainly using proprietary models derived from value chain analysis. These markets models used are capable of interpreting market dynamics for strategy formulation as well as price forecasting.  Though these models are fungible across any market, specific use has been done in interested markets of crude, palm oil and metals.

He can be reached through his Linkedin Page or Via email at mssganesh@gmail.com .

Source: Linkedin Article

Sunday 20 September 2015

Market Signals for the US S and P 500 Index and Indian Stock Market Nifty Index for the Week beginning September 21


Indicator
Weekly Level / Change / Significance
Implication for
S & P 500
Implication for Nifty*
S & P 500
1958, -0.15%
Neutral
Neutral
Nifty
7982, 2.47%
Neutral**
Bullish
China Shanghai Index
3098, -3.20%
Bearish
Bearish
Gold
1139, 2.82%
Bullish
Bullish
WTIC Crude
45.32, 1.21%
Bullish
Bullish
Copper
2.38, -2.94%
Bearish
Bearish
Baltic Dry Index
960, 17.36%
Bullish
Bullish
Euro
1.1300, -0.31%
Neutral
Neutral
Dollar/Yen
119.52, -0.89%
Bearish
Bearish
Dow Transports
8036, -0.19%
Neutral
Neutral
US 10 year Bond Yield
2.13%, -2.43%
Bullish
Bullish
Nyse Summation Index
-377, 27.91%
Bullish
Neutral
US Vix
22.28, -3.97%
Bullish
Bullish
20 DMA, S and P 500
1953, Above
Bullish
Neutral
50 DMA, S and P 500
2039, Below
Bearish
Neutral
200 DMA, S and P 500
2069, Below
Bearish
Neutral
20 DMA, Nifty
7846, Above
Neutral
Bullish
50 DMA, Nifty
8233, Below
Neutral
Bearish
200 DMA, Nifty
8402, Below
Neutral
Bearish
India Vix
18.29, -26.76%
Neutral
Bullish
Dollar/Rupee
65.84,- 0.67%
Neutral
Bullish


Overall
 S & P 500
Nifty

Bullish Indications
7
9

Bearish Indications
5
5

Outlook
Bullish
Bullish

Observation
The Sand P 500 was unchanged and the Nifty rallied last week. While indicators are bullish,
any bounces will be short lived and massive declines are likely in both indices in the upcoming months.


On the Horizon
Greek Elections, US Durable Goods, Japan CPI.


*Nifty
India’s Benchmark Stock Index


Raw Data
Courtesy Google finance, Stock charts, FXCM


**Neutral
Changes less than 0.5% are considered neutral


Hottest Deals On Refurbished Apple Products | JemJem
The markets recovered last week. Signals are nominally bullish for the upcoming week and markets are in #crash mode. The #SandP500 and several global indices are completing massive bear flags which are resolving to the downside. The U.S FOMC can do nothing to change this. There will be more downside upcoming in the #Nifty and the S and P 500, with at least a retest of the lows for the S and P 500 near 1867 and Nifty near 7550 this month. You can check out last weeks report for a comparison. You can also check out snapshots of the S and P 500 and Nifty Indices. Love your thoughts and feedback.

Stock Market News

Amazon Deals

World Indices


Live World Indices are powered by Investing.com

Market Insight

My Favorite Books

  • The Intelligent Investor
  • Liars Poker
  • One up on Wall Street
  • Beating the Street
  • Remniscience of a stock operator

See Our Pins

Trading Ideas

Forex Insight

Economic Calendar

Economic Calendar >> Add to your site

India Market Insight

My Asset Allocation Strategy (Indian Market)

Cash - 40%
Bonds - 20%
Fixed deposit - 20%
Gold - 5%
Stocks - 10% ( Majority of this in dividend funds)
Other Asset Classes - 5%

My belief is that stocks are relatively overvalued compared to bonds and attractive buying opportunities can come along after 1-2 years. In a deflationary scenario no asset class does well other than U.S bonds, the U.S dollar and the Japanese yen, so better to be safe than sorry with high quality government bonds and fixed deposits. Cash is the king always. Of course this varies with the person's age.