About

Ahead of the Curve provides you with analysis and insight into today's global financial markets. The latest news and views from global stock, bond, commodity and FOREX markets are discussed. Rajveer Rawlin is a PhD and received his MBA in finance from the Cardiff Metropolitan University, Wales, UK. He is an avid market watcher having followed capital markets in the US and India since 1993. His research interests includes areas of Capital Markets, Banking, Investment Analysis and Portfolio Management and has over 20 years of experience in the above areas covering the US and Indian Markets. He has several publications in the above areas. The views expressed here are his own and should not be construed as advice to buy or sell securities.

Featured post

Time Series Analysis with GRETL

This video shows key time-series analyses techniques such as ARIMA, Granger Causality, Co-integration, and VECM performed via GRETL. Key dia...

Showing posts with label skew. Show all posts

Wednesday 27 March 2019

Indicators that Matter

There is a plethora of indicators to track while evaluating financial markets. Here are some important ones:

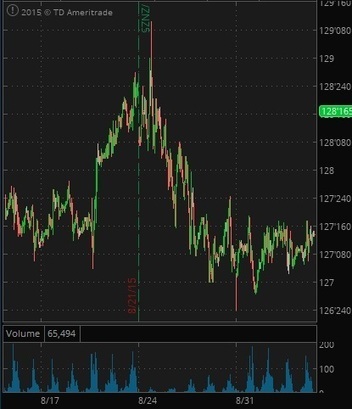
1) The Chinese Yuan:

The Chinese Yuan is often a proxy for the risk on trade. Periods of strength in the Chinese Yuan as seen in the last 3 months, have often been accompanied by up moves  in risk assets such as stocks, commodities and emerging market currencies:

source:investing.com

chinese yuan
2) The S and P 500 Price to Sales Ratio:

This is a key valuation measure and price to sales ratios greater than 2 have often symbolized over valuation while ratios lower than 1 have produced undervalued buy opportunities:

source: multpl.com

valuation

3) The Yield Curve:

The yield curve is a very reliable economic indicator and an inverted yield curve like we have now has often been followed by recessions or periods of rapidly slowing growth, while an upward sloping yield curve is often indicative of an expanding economy:

source: ETF Trends
yield curve

4) CNN Money's Fear and Greed Indicator:

This is a sentiment indicator which is a combination of several sentiment indicators and indicates whether market participants are fearful or greedy:

source: CNN Money

fear and greed

5) The Skew Vix Ratio:

This indicator is another sentiment indicator and values below 5 tend to mark panic bottoms while values above 15 tend to mark complacent tops. This ratio has been making lower highs and lower tops of late suggesting that there may be one more panic bottom in the not too distant future:

source: Stock Charts

skew vix ratio


Thursday 16 August 2018

Why a Massive Selloff in Risk Assets Could be Just a Few Days Away?

First market breadth is diverging with the New 52 week high low indicator not confirming the recent retest of highs in the S and P 500:

S&P 500 vs S&P 500 Stocks at 52-Wk Highs Minus Lows (S&P 500 NH-NL)

High beta segment of the market such as the Nasdaq is beginning to under perform the broader market much like in 2000:

S&P 500 vs Nasdaq Relative to its 200-Day Moving Average (Nasdaq R200)

The Skew Vix ratio as shown on stockcharts has spiked into double digits recently suggesting high tail risk, which is often a precursor to rising volatility and a risk off trade set up:

skew vix ratio


All this as we are in the middle of an emerging market currency crisis much like in 1998 unsupported by a tightening FED:

Thursday 16 November 2017

Some Developing Bearish Divergences

Here are some divergences developing that are worth watching:

Crude Oil is close to its recent highs but junk bonds have broken down from recent highs:
Volatility and the Skew have been steadily pushing upwards:

Wednesday 21 October 2015

Interesting Market News and Views from global financial markets-3

1)Just 1pc of fund managers have beaten the stock market since Black Monday - Telegraph

A fund that aims to mirror Warren Buffett’s investment style has beaten the
FTSE since Black Monday, but the vast majority of active funds have lagged
behind"

2)The skew view - the latest signal of stock-market doom? - Reuters

Wall Street is forever on the lookout for ever more exotic indicators of impending doom for the stock market, and the latest measure to catch eyeballs is the CBOE Skew index .SKEWX which recently flashed panic signals like never before."

3) 38 Images of The 2015 Stock Market Crash

During the August 2015 stock market crash, markets around the world dropped significantly. What was the cause? The media blames China, but were they?"


4) Stock market crash sets new records in 1987 - New York Daily News

Stock market crashes in 1987, under a selling avalanche of over half a billion shares, as traders recalled the Great Crash of 1929."


5) 3 Reasons Stock Market Corrections Are Inevitable - Motley Fool

You may not want the stock market to fall, but it's only a matter of time."

6) Deflation's least-understood danger is also its most serious

The world is grievously underestimating the danger of deflation."

Here are some more interesting market news and views. 

Stock Market News

Amazon Deals

World Indices


Live World Indices are powered by Investing.com

Market Insight

My Favorite Books

  • The Intelligent Investor
  • Liars Poker
  • One up on Wall Street
  • Beating the Street
  • Remniscience of a stock operator

See Our Pins

Trading Ideas

Forex Insight

Economic Calendar

Economic Calendar >> Add to your site

India Market Insight

My Asset Allocation Strategy (Indian Market)

Cash - 40%
Bonds - 20%
Fixed deposit - 20%
Gold - 5%
Stocks - 10% ( Majority of this in dividend funds)
Other Asset Classes - 5%

My belief is that stocks are relatively overvalued compared to bonds and attractive buying opportunities can come along after 1-2 years. In a deflationary scenario no asset class does well other than U.S bonds, the U.S dollar and the Japanese yen, so better to be safe than sorry with high quality government bonds and fixed deposits. Cash is the king always. Of course this varies with the person's age.